
RESEARCH NOTE / MATHEMATICS
Till Death Do Us Part: Who Goes First?
The mathematics of longevity, age gaps, and widowhood.
ABSTRACT
This essay asks why the arithmetic of life expectancy is not enough to predict who outlives whom. It combines survival distributions, spousal age gaps, demographic evidence, and a transparent Monte Carlo experiment to show how the probability and duration of widowhood emerge from overlapping lifetimes rather than fixed dates. The simulation is deliberately stylized: it is designed to clarify the mechanism, not to estimate a particular population's mortality risk. The article also separates population-level patterns from individual predictions and discusses what a serious analysis would need to add, including cause-of-death pathways, dependence between partners, and country-specific life tables.
- Published
- Updated
- Reading time
- 11 min
- Author
- Natoandro
VERSION HISTORY 1 archived version
People often explain late-life widowhood with a subtraction: women live longer, men are often older, so a woman should expect to outlive her husband by the difference. That intuition points in the right direction, but the arithmetic is wrong. [, ]
The reason is simple. Life expectancy is an average. A couple’s deaths are two random events drawn from overlapping survival distributions, not two fixed dates. To reason about widowhood, we need the distributions themselves.
The two demographic forces
Across the populations studied by Bergeron-Boucher and colleagues, female survival is generally higher than male survival, but the lifespan distributions overlap substantially. Their outsurvival statistic shows that a non-trivial share of men outlive a randomly paired woman even when women have higher life expectancy.
The second force is the age composition of couples. In many different-sex couples, the husband is older, which shifts the couple-level comparison beyond a simple contrast between male and female population averages. Register-based evidence also shows that the relationship between spouse age gap and survival depends on which partner is older and on the sex of the person being studied. The next two sections examine these forces separately.
Why do men often die earlier?
The graph above is useful for scale, but it is not yet a widowhood calculation. These are period averages at birth. A couple-level analysis needs remaining-lifetime distributions conditional on the partners’ current ages, plus a model for dependence between their risks.
There is no single worldwide cause. The sex gap reflects a changing mixture of smoking histories, cardiovascular and respiratory disease, occupational and behavioral exposures, health-care use, social conditions, and possibly biological factors. Case and Paxson show why the gap should not be read as a simple difference in the number of diagnosed conditions: in their U.S. data, some conditions had more adverse effects on male mortality.
Smoking is a particularly clear example of why timing and cohort matter. Preston and Wang report that the U.S. gap at ages 50–84 widened and later narrowed across birth cohorts from 1948 to 2003, with smoking histories providing a substantial explanation in an age-period-cohort analysis. That result should not be exported mechanically to Madagascar, Sweden, or any other population. A proper cause-of-death analysis would use age-, sex-, country-, and period-specific death counts, then decompose the life-expectancy gap by cause while preserving uncertainty.
Why husbands are often older
A descriptive baseline comes first: a study of current different-sex couples in 130 countries reports that men are 4.2 years older than their partners on average, with substantial regional variation. That result establishes the pattern, but not its cause.
A useful explanation begins before widowhood, with the timing of marriage itself. In panel data from Nepal, unmarried young people and their parents considered younger ages more acceptable for women than for men. Those timing attitudes accounted for about one-third of the gender gap in marital timing in that setting. This is evidence for a social-norm mechanism, not a universal rule: the study concerns one population and does not show that every society produces the same pattern.
Marriage markets also shape which age combinations are available. U.S. evidence suggests that people with more schooling and more upwardly mobile occupations interact more heavily with similarly aged peers and are more likely to marry someone close in age. Comparative evidence from Ghana and Kenya similarly finds that large age gaps declined through a mixture of changing education composition and changing partner selection within education groups, with the balance differing between the two countries.
The broader cross-national pattern is consistent with this institutional interpretation. In 89 countries, men married younger women in every country studied, but the age gap declined with development. Taken together, these studies point to gendered marriage timing, education, peer networks, and marriage-market conditions as interacting mechanisms. They do not establish one biological or cultural cause that applies everywhere.
Compton and Pollak illustrate why the age gap matters for widowhood with a 60-year-old wife and a 62-year-old husband, an age pairing close to the average in their 2010 reference population. Comparing the two individual life expectancies does not, by itself, recover either the couple’s joint life expectancy or the survivor’s expected years of widowhood. Register-based research also finds that the association between spouse age gap and survival varies by the sex of the person and by whether the spouse is older or younger.
The female survival advantage makes a woman more likely to be the surviving partner in a heterosexual couple, on average. Age ordering within couples can shift that comparison further. Neither factor determines any particular couple’s future. The result depends on age, sex, country, mortality conditions, and the overlap between the partners’ survival distributions. The sex gap itself is also a population pattern with multiple contributors, not a fixed constant.
Why subtracting life expectancies fails
Let and denote the remaining lifetimes of a woman and a man. If their current ages are and , write their conditional survival functions as
Under an independence assumption, the probability that the woman outlives the man is [, ]
where is the density of the man’s remaining lifetime. The corresponding probability that the man outlives the woman is obtained by exchanging the roles.
This is a model, not a universal law. Partners’ mortality can be correlated through shared environments, behaviours, socioeconomic conditions, and the health consequences of bereavement. Bergeron-Boucher and colleagues explicitly caution that their cross-population outsurvival statistic does not model dependence between members of a couple. Jevtić and Hurd develop a probabilistic framework that can represent dependence before and after the first death.
The expected difference in individual lifetimes, , is therefore not the same quantity as the expected number of years the woman survives after the man’s death. A useful survivor-years measure is
It counts the woman’s post-partner years as zero in cases where she dies first. A conditional version,
asks a different question: if she is the surviving partner, how long does she survive him on average?
Compton and Pollak’s central methodological warning is that individual life expectancies can overstate joint life expectancy and substantially understate survivor life expectancy. Their calculations are based on U.S. life tables and randomly formed couples, so they are benchmarks rather than predictions for every real couple.
What a small computational experiment can show
With sex- and age-specific life tables, we can construct hypothetical couples and vary one factor at a time. A life table is not just a list of averages: it translates observed mortality rates into survival probabilities that can be combined in the calculations above.
| Woman | Man | Age difference | Question |
|---|---|---|---|
| 60 | 60 | 0 years | How much does the sex mortality gap matter? |
| 60 | 62 | Man 2 years older | What does a typical age gap add? |
| 60 | 65 | Man 5 years older | How quickly does the outsurvival probability change? |
| 65 | 60 | Woman 5 years older | What happens when the age ordering reverses? |
A transparent simulation
The formulas become more concrete when we simulate the same question under controlled assumptions. The accompanying notebook is available as a readable static HTML page and generates 200,000 independent couples for each husband-wife age gap from −5 to +10 years. It uses Weibull remaining-lifetime distributions with shape 4, a 25-year mean remaining lifetime for the 60-year-old woman, and a 22-year mean for a man of the same age. Each additional year of the man’s age reduces his modeled mean remaining lifetime by 0.55 years.
These parameters are a pedagogical model, not estimates fitted to one country’s life table. Their purpose is to isolate the age-gap mechanism. The fixed seed makes the Monte Carlo output reproducible, while the CSV exposes every scenario and summary statistic. The simulation keeps the partners independent, so it does not model shared behaviors, assortative health, or bereavement effects.
We also ask how often the survivor interval is short, regardless of which partner survives. Let be the years between the two deaths. Then is the probability that the survivor is widowed for less than one month, and is the probability that the interval is less than one year. These are symmetric couple-level probabilities, not probabilities for the woman alone. At a zero age gap, the simulation gives 0.66% and 7.94%, respectively; when the man is ten years older, they fall to 0.47% and 5.71%. The age-gap pattern here reflects the particular independent Weibull model, not a general empirical law.
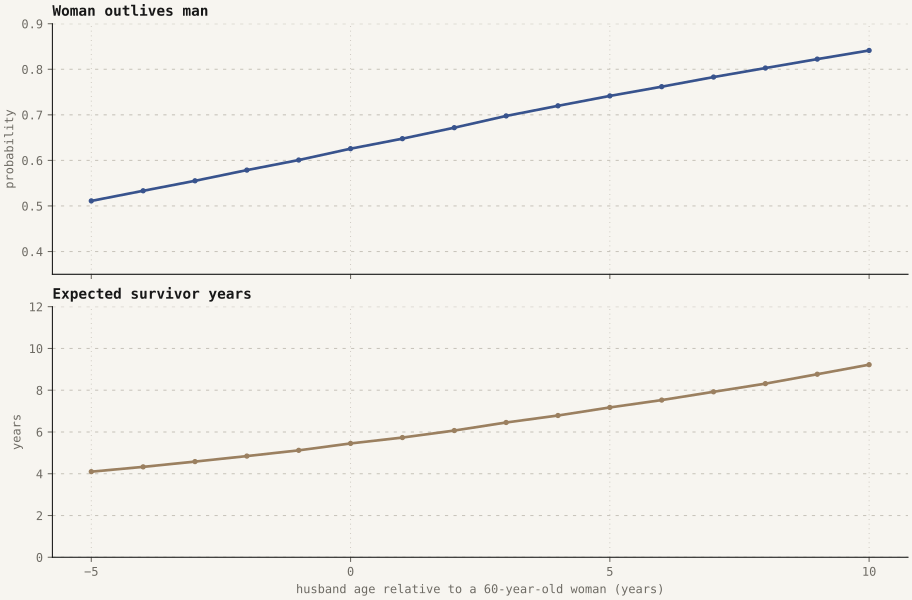
For each pairing, calculate:
- , the probability that the woman outlives the man;
- and , probabilities of surviving at least five or ten additional years;
- , expected survivor years without conditioning on who dies first; and
- , expected survivor years among women who outlive their partners.
- and , probabilities that either partner’s survivor interval is under one month or one year.
The Bracket Lab below shows how this modeled probability changes with the husband’s age gap: . The highlighted point is the peak modeled probability in this monthly-resolution grid, not an “ideal age gap” or a recommendation about real relationships.
Repeating the experiment across countries separates a mortality effect from a composition effect. Holding the age gap fixed while changing the life tables changes the sex-specific mortality component. Holding the life tables fixed while changing the age gap changes the couple-composition component. These calculations are benchmarks, not a complete model of coupled lives: pairwise dependence and changes in the survivor’s mortality after the first death require an explicitly dependent model. [, , ]
Widowhood is not the same as living alone
The mathematics concerns the ordering of deaths. It does not measure whether a surviving partner lives alone, feels lonely, enters another relationship, or lives with family. Those are different outcomes and require different data. International mortality comparisons also show that marital-status categories have different age- and sex-specific patterns, so “widowed,” “divorced,” and “living alone” should not be treated as interchangeable labels.
Widowhood can also affect the survivor’s health. A nationally representative U.S. cohort of 373,189 older married couples followed from 1993 to 2002 found an association between spousal death and increased all-cause mortality for the bereaved partner. Reviews synthesize evidence on mortality, psychological distress, health behavior, and other bereavement outcomes. [, ] This is evidence about associations in observational and review research, not a reason to treat every survivor’s outcome as predetermined.
The practical conclusion is modest but useful: women are, on average, more likely to outlive male partners in many populations, and an older male partner shifts that probability further. But the correct calculation uses survival distributions, not a subtraction of two life-expectancy averages. The uncertainty is not a nuisance around the answer. It is the answer’s structure.
Open questions
- How much do shared behaviours and socioeconomic conditions change couple-level survival dependence?
- How do same-sex couples and non-marital partnerships alter the age-gap and repartnering mechanisms?
- Which life-table summary best supports decisions about pensions, care needs, and household financial planning?
- How should a model distinguish surviving a partner from living alone or experiencing loneliness?
Notation and prerequisites
The main text introduces each lifetime variable, age, survival function, density, expectation, and positive-part operator where it first appears. This end section records only the convention that is easiest to overlook and the background needed to follow the derivation.
- The vertical bar
|means “conditional on.” For example, conditions the survival probability on the woman’s current age. - The calculations assume familiarity with conditional probability, probability densities, integrals, and expected values. No measure-theoretic probability is needed for the arguments shown here.
Suggested rigorous readings
For a more formal treatment, the following books provide a progression from probability to survival analysis and life-contingency mathematics:
- Probability: Grimmett and Stirzaker, Probability and Random Processes, 3rd ed. develops probability, conditional probability, independence, and random processes rigorously.
- Survival analysis: Klein and Moeschberger, Survival Analysis: Techniques for Censored and Truncated Data, 2nd ed. develops survival functions, censoring, truncation, competing risks, and estimation.
- Life contingencies: Dickson, Hardy, and Waters, Actuarial Mathematics for Life Contingent Risks, 3rd ed. develops life-contingency models and multiple-state methods used in actuarial work.
These are suggested study paths rather than sources for the empirical claims in this article. The article’s numbered bibliography contains the papers used for those claims.
Bibliography
- Marie-Pier Bergeron-Boucher, Jesús-Adrian Alvarez, Ilya Kashnitsky, Virginia Zarulli, Probability of males to outlive females: an international comparison from 1751 to 2020. 2022. doi:10.1136/bmjopen-2021-059964
- Janice Compton, Robert A. Pollak, The life expectancy of older couples and surviving spouses. 2021. doi:10.1371/journal.pone.0250564
- Anne Case, Christina Paxson, Sex differences in morbidity and mortality. 2005. doi:10.1353/dem.2005.0011
- Sven Drefahl, How does the age gap between partners affect their survival?. 2010. doi:10.1353/dem.0.0106
- World Bank, Life expectancy at birth, female and male (years), 2022. 2026. Source
- Samuel H. Preston, Haidong Wang, Sex mortality differences in the United States: The role of cohort smoking patterns. 2006. doi:10.1353/dem.2006.0037
- Jacob Ausubel, Stephanie Kramer, Anne Fengyan Shi, Conrad Hackett, Measuring age differences among different-sex couples: Across religions and 130 countries, men are older than their female partners. 2022. doi:10.1080/00324728.2022.2094452
- Kelly Allendorf, Arland Thornton, Caitlin Mitchell, Linda Young-DeMarco, Dirgha J. Ghimire, Early Women, Late Men: Timing Attitudes and Gender Differences in Marriage. 2017. doi:10.1111/jomf.12426
- Hani Mansour, Terra McKinnish, Who Marries Differently Aged Spouses? Ability, Education, Occupation, Earnings, and Appearance. 2014. doi:10.1162/REST_a_00377
- Afua Durowaa-Boateng, Endale Kebede, Shifting spousal age gaps in Kenya and Ghana: Does education matter?. 2025. doi:10.4054/DemRes.2025.53.41
- Ying Feng, Jie Ren, Within marriage age gap across countries. 2022. doi:10.1016/j.econlet.2021.110190
- P. Jevtić, T. R. Hurd, The joint mortality of couples in continuous time. 2017. doi:10.1016/j.insmatheco.2017.05.002
- Nathan Keyfitz, Finding Probabilities from Observed Rates or How to Make a Life Table. 1970. doi:10.1080/00031305.1970.10477174
- Yuanreng Hu, Noreen Goldman, Mortality Differentials by Marital Status: An International Comparison. 1990. doi:10.2307/2061451
- Felix Elwert, Nicholas A. Christakis, The Effect of Widowhood on Mortality by the Causes of Death of Both Spouses. 2008. doi:10.2105/AJPH.2007.114348
- J. Robin Moon, Naoki Kondo, M. Maria Glymour, S. V. Subramanian, Widowhood and Mortality: A Meta-Analysis. 2011. doi:10.1371/journal.pone.0023465
- Margaret Stroebe, Henk Schut, Wolfgang Stroebe, Health outcomes of bereavement. 2007. doi:10.1016/S0140-6736(07)61816-9